Creating a new dashboard
- Click ”+ Dashboard” from your Basedash workspace
- Give your dashboard a name
- Start creating charts using AI
Managing your dashboard
Layout and organization
- Resize and arrange charts by dragging
- Group related metrics together
- Add markdown text blocks for context
- Create sections with headers
Filters
- Add dashboard-wide filters
- Create date range selectors
- Filter by specific dimensions
- Apply filters to multiple charts
Auto-refresh
By default, dashboards refresh every 5 minutes to keep your data up-to-date. You can change the refresh interval to fit your needs.Sharing and collaboration
You can share the dashboards you create with your team members in Basedash, or with the public. You have full control over who can view and edit the dashboard.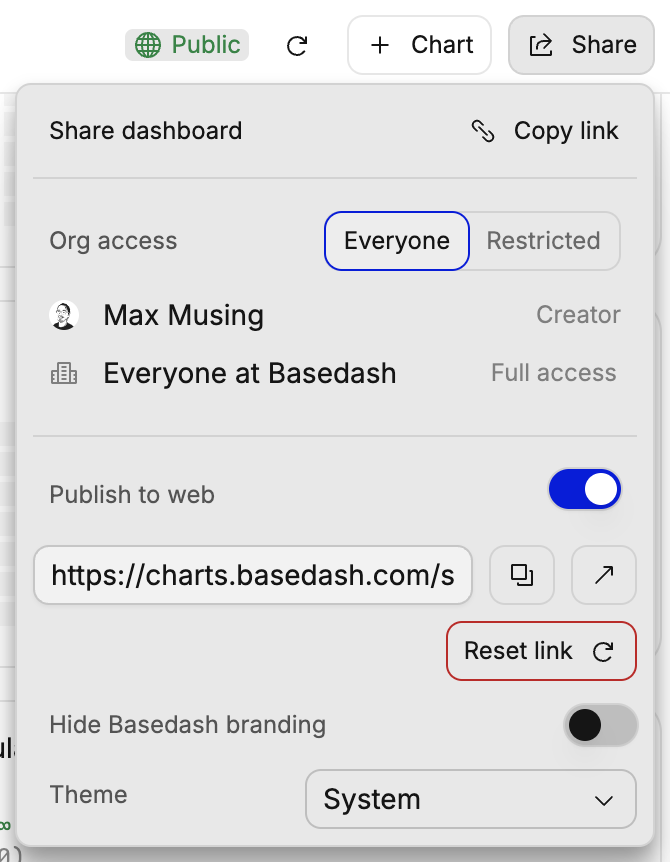
Permission levels
Here are the different access levels you can assign to groups on your dashboard:- Full access: Ability to do anything on a dashboard, including changing access levels.
- Edit access: Ability to edit dashboard properties or charts on a dashboard. You cannot change access levels.
- View access: You can only view charts on a dashboard.
- No access: Cannot view a dashboard.
Restricted access
If you don’t want to give everyone access to a dashboard, you can select the “Restricted” option which lets you specify access for groups on a dashboard.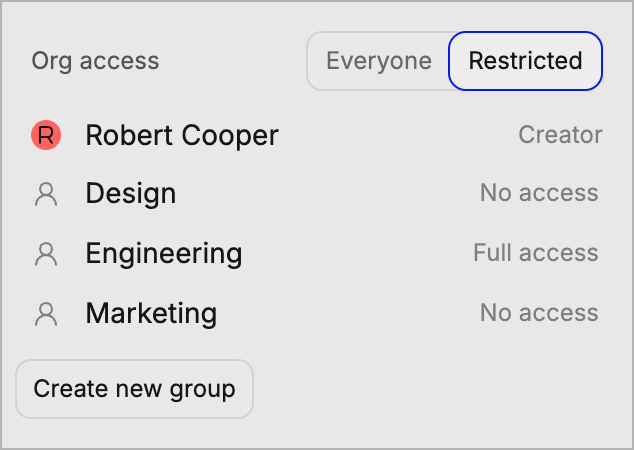
Public dashboards
You can share dashboards outside of Basedash by enabling embedding in the dashboard share menu. This creates a public link at/shared/{id} that you can share with anyone to view the dashboard. The public link does not require a Basedash account to view and only allows viewing, not editing.
You can control the color theme of the public dashboard, and enterprise users can optionally hide Basedash branding.
Embedding dashboards
You can embed dashboards in your own website or app by using the public URL. This will allow you to share the dashboard with your audience, wherever they are. We also support controlling filter values when embedding dashboards. This allows you to share a dashboard with your audience, and control the data that is shown for each user. Contact us for more information on how to set this up.Best practices
We have a full guide on tracking startup metrics.-
Dashboard organization
- Start with high-level metrics
- Group related charts together
- Use clear section headers
- Add context with text blocks
-
Performance
- Limit charts per dashboard
- Use appropriate refresh rates
- Consider query complexity
-
Collaboration
- Add dashboard descriptions
- Document data sources
- Share access appropriately
- Keep stakeholders updated